Data Literacy is HOT at Minneanalytics Data Tech 2019
/For people on the technology side of analytics and data science, there can often be a sense of frustration that the business teams don’t fully understand how to use the data, models, insights, and reports that we create for them. Business teams need to DO SOMETHING with the data, or you won’t see the ROI on your analytics projects.
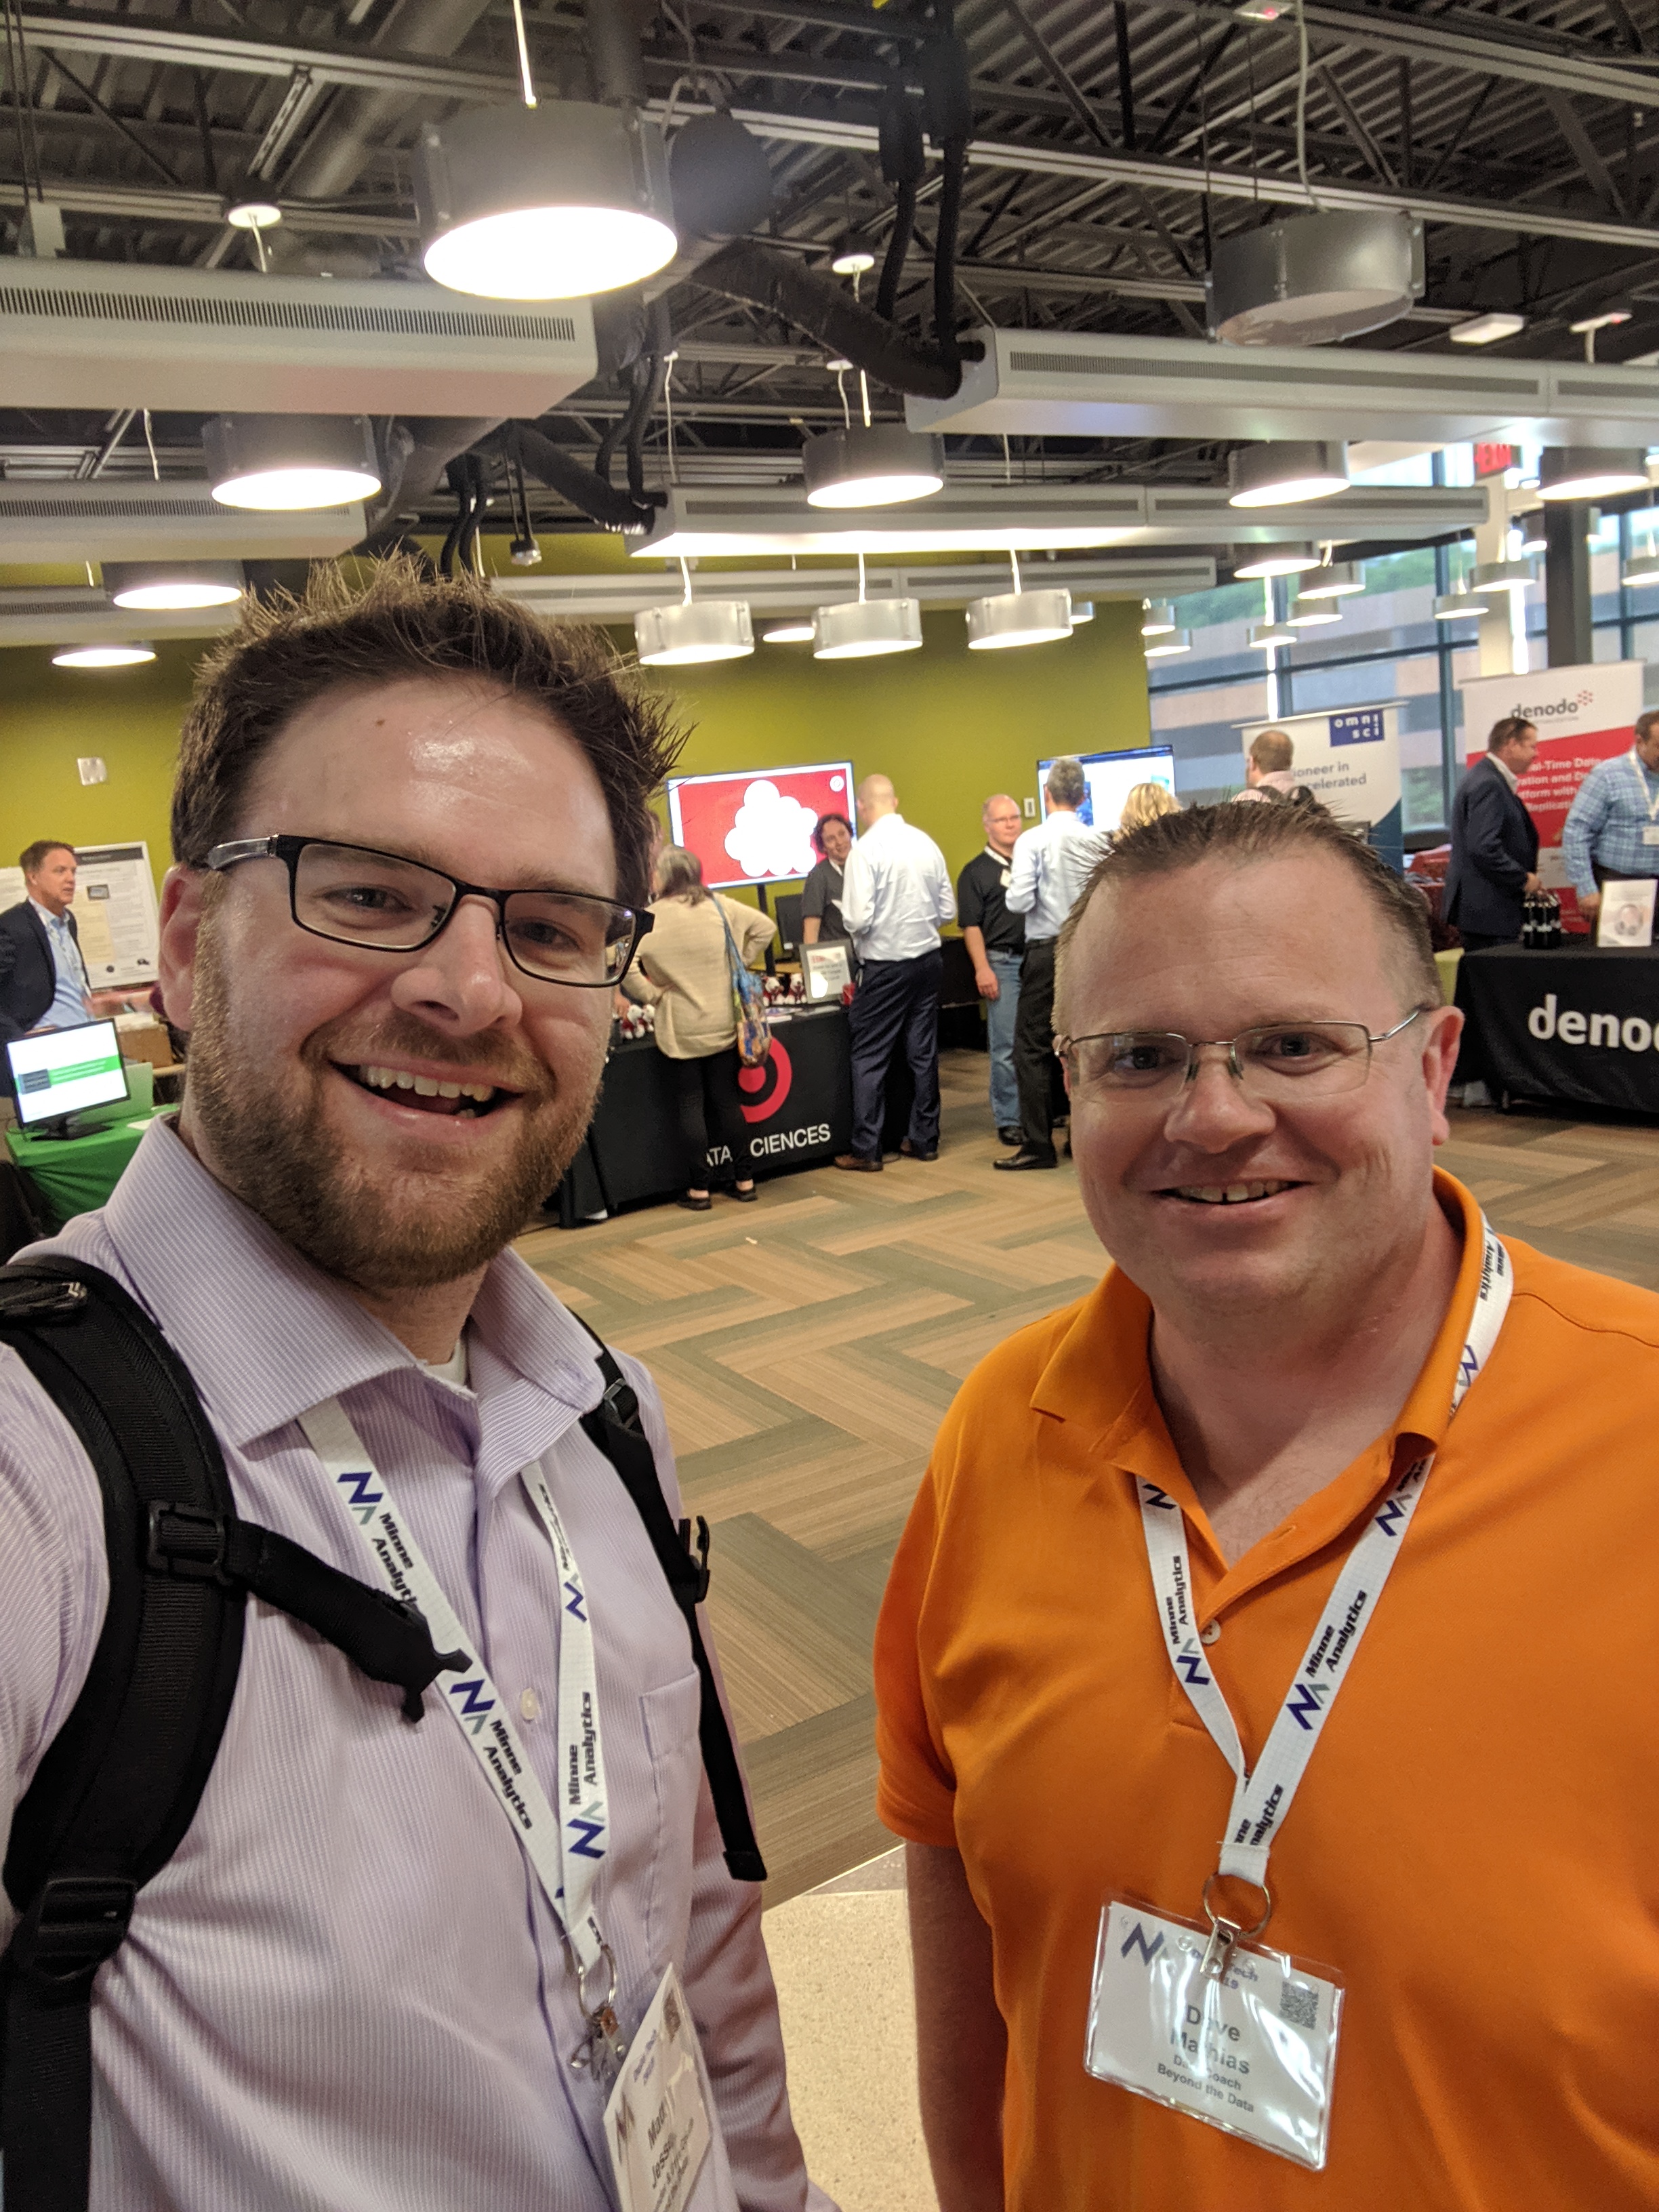
Matt and Dave checking out the vendor hall at Minneanalytics Data Tech 2019
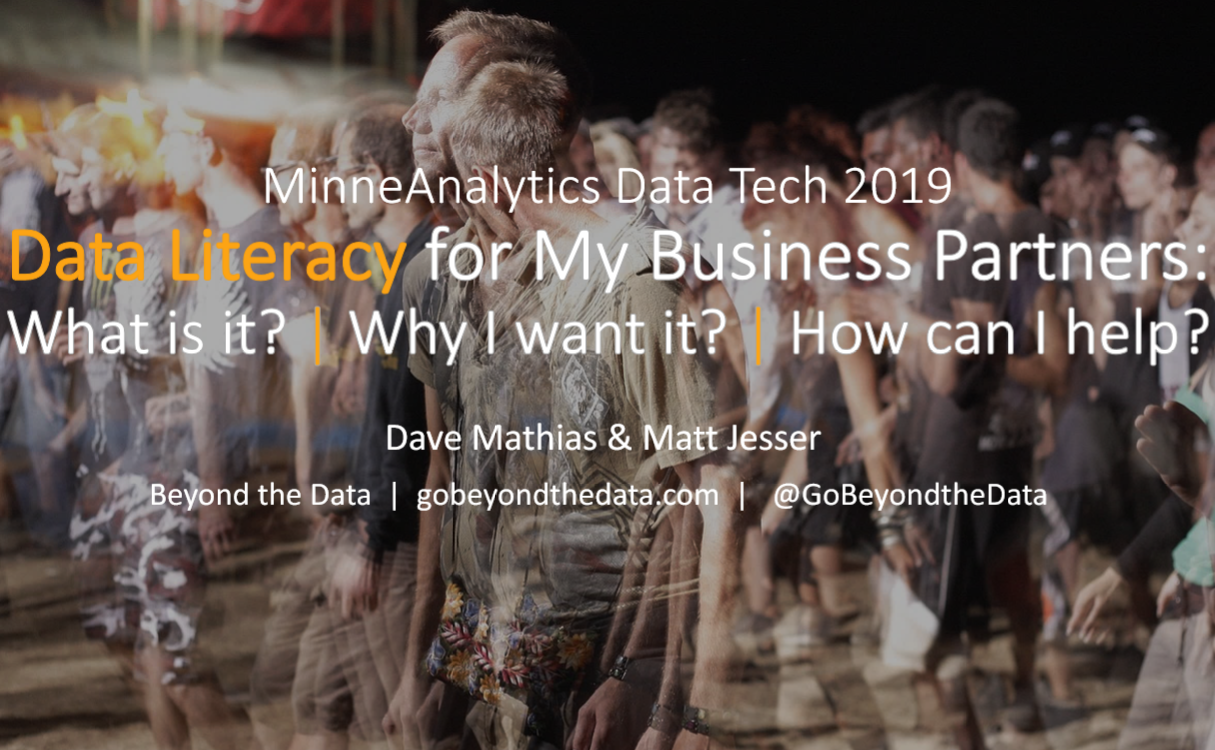
Matt and I had the opportunity to speak about exactly this topic at the 5th Annual MinneAnalytics Data Tech 2019 conference in the Twin Cities last week. The conference was buzzing with energy this year, with over 1,300 people registered!
We were interested to see how a Data Literacy topic would be received at a conference designed for Data Science and Information Tech people. It turns out that both business and technical people are interested in improving the fundamental data capabilities of their organizations, as 200 people signed up for the event!
Our key message was simple: If you’re an analyst or data scientist, and feel like the business team doesn’t quite “get” what you’re doing… start building relationships with them! Data Literacy for your business teams start with you. They know that data can help them, but you need to bring them along the journey.
To that end, here are our three ideas for Data Science, Analytics and BI teams to start dipping their toes in the water of data literacy for their organization:
Find a business buddy. Get at least one and more preferably business buddies where you can share your knowledge around the power of data literacy. In turn you can get more knowledge around the business domain. Seek out people that are in a similar stage in their career but on business side. important: This is different than and not a mentor relationship.
Do a data viz challenge or hackathon together. Working on the same team in a close time-boxed competitive environment with those that are business-side people will help you empathize and respect them more with them and vice versa. Remember we talk about diversity and it's strength and an element of diverse teams is different organizational backgrounds.
Judge a student data challenge together. There are a lot of student analytics challenges nowadays and they are always looking for judges. Find one and get your business buddy or another business-side person to participate in this challenge as a judge. You will both be better able to understand more of your strengths from the questions you each ask and engagement with student teams. Plus you will be doing a social good by doing this and better helping these students understand different perspectives from an organization.
Thank you MinneAnalytics, their sponsors, and everyone that attended Data Tech 2019 and especially those attending our session. We love coming to these events to see just how powerful a community’s passion around data can be.